Exploratory Analyses for Y2K, New Year, 1999 to 2000

Because the Y2K transition was both complex and important to the GCP, we have conducted a large number of exploratory analyses, some of which are quite interesting even though they cannot be used as evidence in support of any Formal Predictions. In addition to the material in this survey of explorations, various other subsidiary analyses have been performed to examine the data taken around the time of the New Year transition. These are available for study in the First Results page and via other links.


Formal prediction, RDN, analysis by George deBeaumont

Based on the significant results shown during the New Year transition 1998 to 1999, a similar prediction was made that the Y2K data would show unusual structure around midnight, specifically in the period midnight ± 5 minutes, across all eggs and all time zones. The prediction specified that the raw second-by-second data would be used, and that the measure would be the composite Chisquare representing the total deviation from expectation across all data for the 10-minute period.

One of the assumptions made for the sake of hypothesis generation for the GCP is that the effects are spatially non-local, and under this assumption, each egg is affected by co-temporaneous events, no matter where they take place on the earth. Thus, at midnight in any given time zone, we hypothesize that the effects of the conscious engagement of everyone celebrating there will be felt by all eggs in the GCP network. An hour later, when the celebration reaches the next time zone, there will again be a global effect, impinging on all of the GCP recording devices.

The following composite figure for 10 timezones and 22 eggs was constructed on a slightly different hypothesis, using data only from timezones where one or more eggs are located. It uses about one-fourth of the intended data, because not all eggs had reported when it was completed, but primarily because it excludes data corresponding to the celebration period for all timezones which did not have an egg.

Synchronized deviation of Chisquare: 22 eggs, 10 timezones, GdB

The figure does not show a consistent positive trend, so that for this subset of the data we would have to conclude that the formal prediction of a deviation in the 10 minutes surrounding midnight is not supported. However, the non-locality assumption requires that all eggs and all timezones be used in the analysis, and on March 10, 2000, we were able to construct the complete analysis.

Synchronized sum of 22 eggs

Synchronized Deviation: 21 eggs, 10 timezones, RDN

First, to check that the computations would produce approximately the same result, the data from the same 10 timezones (actually 21 eggs instead of 22; I had problems dealing with missing data in one case) used by George deBeaumont were synchronized and plotted. The resulting cumulative deviation trace is roughly similar in form and the statistical outcome is virtually the same, with Chisquare = 579.93 on 600 df, p = 0.704.

RDN, Synchronized sum of
22 eggs

Final Synchronized Deviation of Chisquare, Midnight ± 5 Min, Y2K

The intended analysis for this prediction requires the use of data from all eggs and all timezones. Data are available from 27 eggs across the 24-hour period of celebration around the world. Following George's precedent for the JAM analysis, all 36 zones with integer or half-hour differences from GMT were used for the following figure. In contrast to the 22 egg, 10 timezone analysis, the deviation is positive, with a Chisquare of 622.251 on 600 degrees of freedom, with an associated p-value of 0.257. This analysis is considered formal, but it has not yet been independently cross-checked.

Synchronized sum of
22 eggs


Independent prediction, Smoothed Variance, Etc.

Dean Radin postulated that an increased coherence will be present in the data, generated in response to the coherent interactions of large numbers of people celebrating the Y2K transition together. This conception leads to a prediction that the spread, or variance of the REG data should be decreased around the moment of greatest engagement. The obvious prediction is for that moment to be just at midnight, with a buildup before and some lingering period of continuing celebration after. The general analysis procedure uses a measure of the variance across all eggs, averaged across time zones, and smoothed with a sliding window, typically 5 minutes wide.

The details of the method are explained in a description of the approach Dean felt was most suitable (Jan 23). I have tried some variations on this general approach, which, in an exploratory mode, simply looks for signs of structure in the data correlated with the timing of the Y2K celebrations. In practice, an exploration sweeps across the data compounded from all the midnights in different timezones. The main tools for such exploration are graphical visualization procedures, and if there is something unusual about the data at the Y2K transition, it may be revealed in a variety of ways.

Except for pre-specified analyses, such as Dean's original prediction of a reduction in variance due to coherent engagement, these analyses are not intended for inclusion in the formal database of GCP predictions. Ed May and James Spottiswoode have provided independent oversight and cross-checks. When their analyses are available they will be added to this survey.

Dean's analysis results in a graph of the average deviation of normalized, superposed, epoch variances. The figure speaks for itself, strongly suggesting that something special did occur in the GCP data around midnight. The detailed description of the steps in Dean's original analysis is interesting and informative. The combined deviation drops precipitously as midnight approaches, and reaches its extreme minimum at three seconds before midnight, the moment of transition.

Deviation of normalized variance, GCP Data, Y2K

Z-score, Average Deviation of eggs at Y2K

Other explorations using a related kurtosis measure (X = e^-kurt) yielded similar results, buttressed by an extensive permutation analysis and application of the procedures to data from 1, 2, and 15 days after the Y2K transition. 
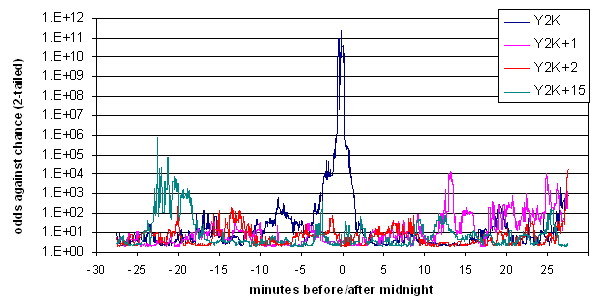
The following two figures display these results, but note, due to a computation error, the y-axis scale is incorrect and exaggerates the significance; the actual maximum Z is on the order of 3.5, and the odds in the second figure have a maximum of about 10e4 or 10e5, not 10e11.

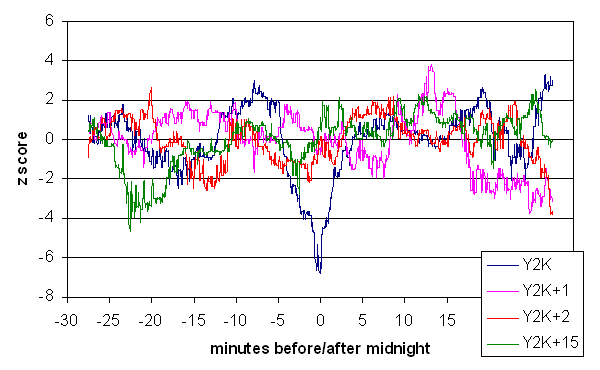
Z-score for Kurtosis Measure, GCP Data at Midnight, Y2K and Controls

Z-score, Kurtosis of eggs at Y2K

Log Odds Against Chance for Kurtosis Measure, Y2K and Controls

Log Odds Ratio of eggs at Y2K

The kurtosis method was applied to the data from the previous year, for comparison. These data show a somewhat similar structure to that of the Y2K transition, but the deviation at midnight is somewhat weaker, and there are competing minima elsewhere.

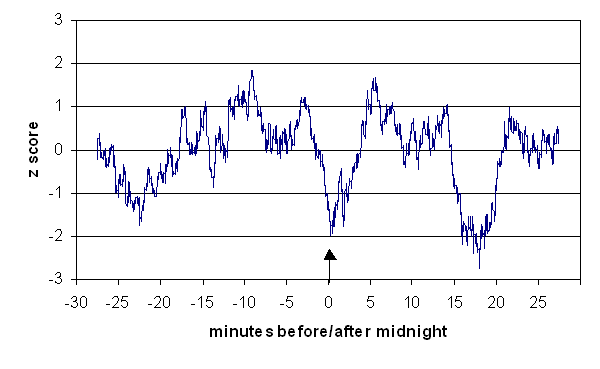
Z-score, Kurtosis measure, GCP Data, New Years, 1998

Kurtosis fig for 1998 data

Confirmatory Explorations, RDN

The figures representing Dean Radin's analyses certainly look as if something is going on around midnight. To gain perspective, I performed several analyses of a generally similar nature, focusing on the question whether the New Year's midnight seemed to be correlated with "special" features in the EGG data. I could not duplicate Dean's analysis exactly (probably because he used a slightly less complete dataset), but by trying a variety of analytic modes, found an impressive array of indicators that parallel his finding and confirm an unusual feature or tendency just at midnight. The situation is far more complicated than is obvious, however. Most of these analyses are sensitive to small changes in the parameters and such factors as the inclusiveness of the dataset. Although this may suggest that the indicators are artifactual and selectively chosen, I think there are far too many and that they are too precisely aligned with the nominal Y2K "target" to be ignored. Fortunately, the data are available for downloading by any interested analyst. They bear examination.

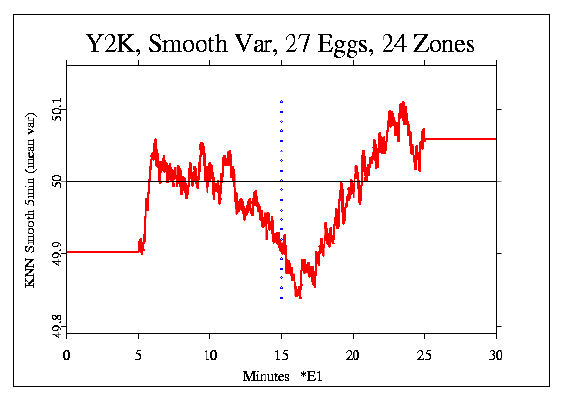
Smoothed Variance, 27 eggs, 24 and 36 timezones

This figure shows midnight plus and minus 15 minutes, with data from 27 eggs and 24 timezones. It is a simpler and more direct implementation of the notion that variability of the data may diminish near midnight. The figure plots the mean across timezones of the variance taken across the 27 eggs for each second, smoothed with a 300-second window. This particular result looks like a striking confirmation of the hypothesis, but if the scale is expanded to include ±30 minutes, another, larger spike appears at 18 minutes after midnight. Furthermore, if the number of timezones is increased to 36 so as to include the several half-hour offset timezones, the picture changes radically. There is no spike at midnight, but instead, a decreasing trend beginning about 5 minutes before and ending about 2 minutes after midnight. Note that this behavior of the variance is entirely consistent with Dean's prediction, even though it does not maximize at midnight.

Smooth var, 27 eggs, 24 zones

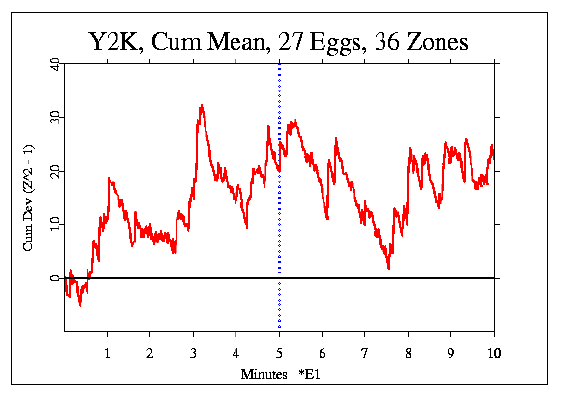
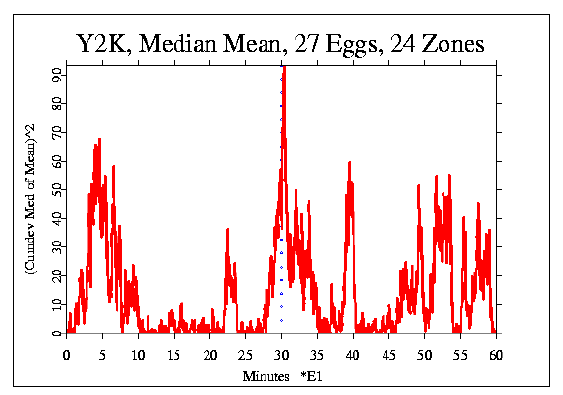
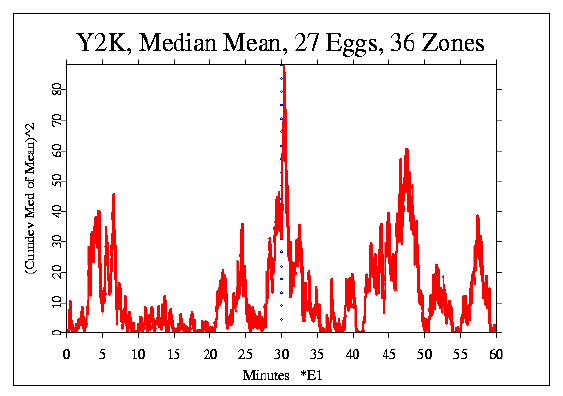
Median Squared Deviation, 27 eggs, 24 and 36 timezones

Another perspective plots changes in the deviation of the mean trial value across eggs over the time surrounding the Y2K transition. The cumulative sum of the median of the squared deviation of the mean from its empirical expectation is plotted, revealing a striking spike at midnight. Interpreted literally, this suggests a brief but very sharp increase in the absolute deviations of trial outcomes just at the moment of greatest engagement in the New Year's celebration.

Notably, this spike is present with little change in its prominence in both the 24-timezone and the 36-timezone datasets, shown in the following two figures. A permutation analysis of the 36-zone case shows that the maximum deviation is not extremely rare, with a greater value appearing somewhere in 90.3% of the permuted datasets. The placement of the spike so close to midnight (it maximizes at 24 seconds after) is, however, quite unlikely; a 4000-permutation analysis yields a p-value of 0.022 of a spike occuring this close or closer to midnight. The combined probability of a spike this large and this close is p = 0.020, suggesting that we might expect to find such impressive structure merely by chance only twice in 100 repetitions of the Y2K experiment. The corresponding numbers for the 24-zone dataset are similar, yielding a combined p-value of 0.017.

Smooth var, 27 eggs, 24 zones

Smooth var, 27 eggs, 36 zones

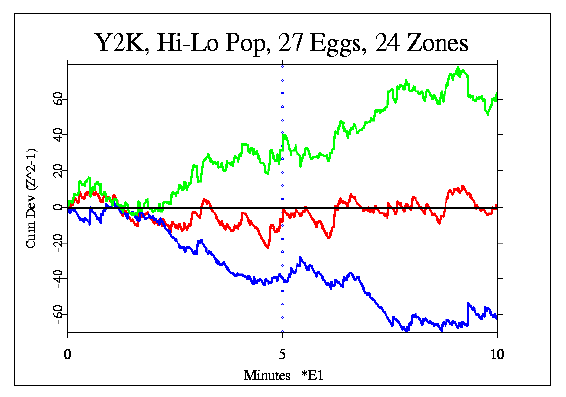
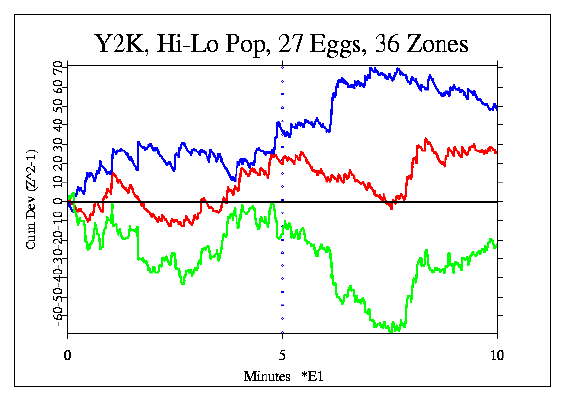
Differences, High and Low Population Zones, 27 eggs

A prediction was made that the high (red curve)and low (blue curve) population timezones would show a difference in the cumulative deviations, based on such a finding last year. The following two figures show this split for 27 eggs across 24 and 36 timezones, respectively. There is a substantial difference in both cases, but interpretation is difficult because the direction of the difference is opposite for 24 and 36 zones, with the 24 zone dataset showing the predicted positive difference (green curve), whereas the results for the 36 zone dataset are opposite to the predicted direction. The difference is significant in the 24 zone case (Chisquare = 663.29, df = 200, p = 0.037), but is not significant for the 36 zone dataset (Chisqare = 577.22, df = 600, p = 0.741). In parallel with the main prediction, the 36 zone results are used for the formal results compilation.

Hi - Lo Split, 27 eggs, 24 zones

Hi - Lo Split, 27 eggs, 36 zones


Return to top

GCP Home